
Top 10 Countries by Revenue: Where Digital Products Thrive
Introduction
When launching a digital product, choosing the right market is just as important as the product itself. Some countries generate significantly higher revenue than others, even if they have similar population sizes. By analyzing aggregated data from multiple micro-products, we’ve identified the top 10 revenue-generating countries and key insights on global market trends.
The results reveal strong patterns—and some surprising insights—about which regions drive the most sales in the digital economy.
1. Global Revenue Distribution: Key Trends
Our analysis shows that the highest-paying markets consistently come from North America, Western Europe, and select Asia-Pacific regions.
🌍 Key Takeaways:
✅ North America & Western Europe dominate the revenue share across most digital products.
✅ Japan, South Korea, and Taiwan perform similarly to Western markets despite being in Asia.
✅ Latin America, Eastern Europe, and Africa contribute little revenue, even with large populations.
✅ Localization & purchasing power matter more than market size—some smaller countries generate significantly higher ARPU (Average Revenue Per User) than larger ones.
Why It Matters: Instead of focusing purely on user acquisition, choosing the right markets dramatically impacts profitability and sustainable growth.
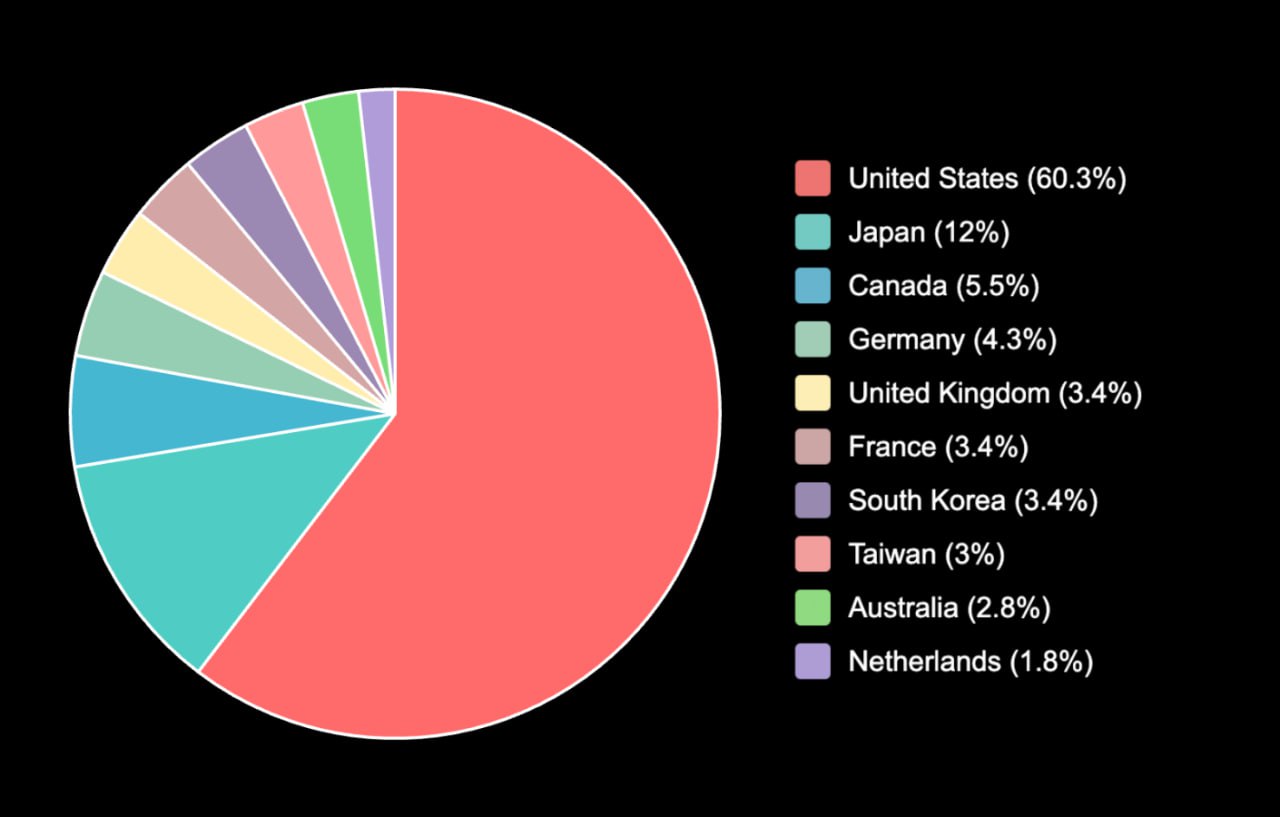
2. The Top 10 Revenue-Generating Countries
Based on cumulative revenue data across multiple products, here’s the ranking:
| Rank | Country | Key Factors |
|---|---|---|
| 🥇 1 | USA | Highest ARPU, large audience, strong purchasing power |
| 🥈 2 | Canada | Similar behavior to the US, high digital adoption |
| 🥉 3 | UK | Strong subscription culture, high SaaS adoption |
| 4 | Germany | High B2B SaaS spending, strong digital economy |
| 5 | Australia | High disposable income, strong English-speaking market |
| 6 | France | Large European market, strong fintech & SaaS adoption |
| 7 | Japan | Unique digital consumption patterns, high trust in subscriptions |
| 8 | South Korea | High mobile app spending, strong digital payment culture |
| 9 | Taiwan | Western-style digital market, strong online commerce |
| 10 | Netherlands | High online engagement, early tech adoption |
Surprising insight: Despite massive populations, China, India, Brazil, and Russia didn’t make the top 10 due to lower spending per user and complex market dynamics.
3. Why Some Regions Generate Low Revenue
Despite large user bases, certain regions underperform in revenue. Why?
❌ Latin America & Eastern Europe
- Lower ARPU (Average Revenue Per User) due to economic conditions.
- Less trust in digital subscriptions—users prefer one-time payments.
- High piracy rates reducing digital product sales.
❌ Africa & “Classic” Asia (India, China, Southeast Asia)
- Large populations, but lower digital spending power.
- Payment infrastructure limitations (e.g., fewer credit card users).
- Strong preference for free/ad-supported models over paid subscriptions.
Takeaway: Entering these markets may require alternative monetization strategies like ads, freemium models, or regional pricing adjustments.
4. How to Choose the Right Market for Your Product
Before launching, analyzing the market potential can prevent wasted resources on regions that won’t generate revenue.
🔍 Key Factors to Evaluate:
✅ Purchasing Power: Does the market have a culture of paying for digital products?
✅ Localization Needs: Does the product require language adaptations?
✅ Payment Preferences: Are credit cards and online payments widely used?
✅ Subscription Culture: Are users comfortable with recurring payments?
✅ Competition: Are local alternatives dominating the market?
Pro Tip: A well-optimized launch strategy in high-value markets can drive 5X more revenue than a broad, unfocused global launch.
Conclusion
Not all markets are equal when it comes to digital product revenue. The top 10 revenue-generating countries consistently include North America, Western Europe, and select Asian economies, while large regions like Latin America, Eastern Europe, and Africa struggle with monetization.
For startups and digital businesses, choosing the right market focus is critical to maximizing revenue, improving profitability, and scaling efficiently.
Need help optimizing your global go-to-market strategy?
agency.pizza specializes in data-driven market analysis, localization, and digital product scaling.
Let’s build smarter, more profitable global strategies!


